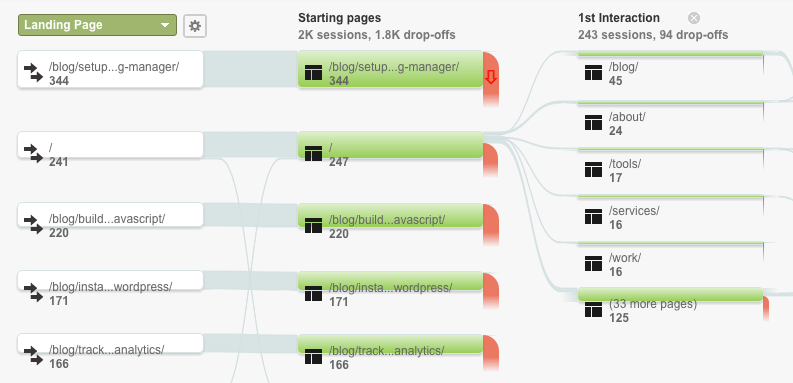
For businesses, there are metrics that you absolutely need to track. Traditionally, it could be profit margins, or employee turnover. With businesses generating and collecting more data, it’s now important to understand what information matters – and how you can use it to guide your decisions.
If you are a marketer, salesperson, or UX designer, you’re thinking about how people are interacting with your website. After all, your website is your entire digital storefront and how customers come into first contact. You may ask: Is it easy to use? Are your marketing campaigns driving conversions? If you have questions about how your business is performing online, then say hello to Google Analytics.
Google Analytics is the most popular web analytics service that can track and report website traffic and information. Firstly, you can get started here.
If you have Google Analytics for your business already, here are some key data points that you can monitor to help out a variety of business objectives.
Demographics (Audience)
In this view, you can find information on your users. This is broken down into the language that they use, their country, and even the city they live in. As a result, you could target a city that is the most receptive to your product or service!
Time Spent (Behaviour)
Here, you can track the average time your users spend on each page. At first glance you may want people to be on your website for longer. However, a long “time spent” isn’t always ideal. A customer could actually be having difficulty finding the right information or button. This is where you need some user research, and observe where users are spending too little (or too much) time on a page.
Bounce Rate (Behaviour)
A bounce rate tells a different story, and measures the percentage of visitors that leave after viewing one page. You want to consider: Is there anything wrong with my website that would have someone leave right away? Also, have you shared your link to people who are not interested in what your website has to offer? Combined with “time spent”, you can get a clearer picture of what is happening.

Data varies when traffic is low, however, trends may appear over time. These metrics will start you on with thinking about data. Google Data Studio works seamlessly with Google Analytics, where you can share insights in a visual way. This data helps you steer your website design, campaigns and or even your entire business to success.
Need an improvement to your website, and to lower your bounce rate? Chatnels is our solution for helping you deliver services online. Try now for free.


